loading.. Please Wait
The Task Report submodule provides detailed insights into task statuses, with features like visual graphs, task listing, filtering, and exporting options.
Features and Functionalities
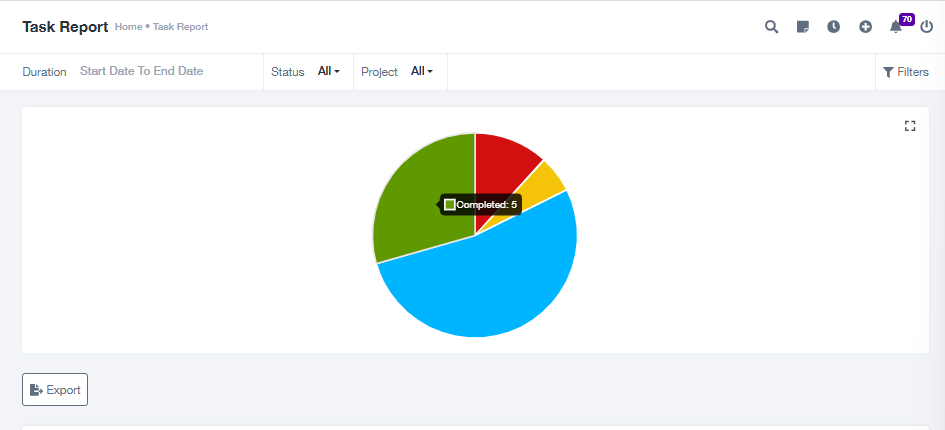
Task Status Graph
Description: A pie chart that displays the distribution of tasks based on their current status:
Incomplete (Red): Tasks that are not completed or in progress.
To Do (Yellow): Tasks planned but not started yet.
Doing (Blue): Tasks currently in progress.
Completed (Green): Tasks that have been finished.
Waiting Approval (Black): Tasks pending approval.
User Interaction:
Hover over the graph to view the number of tasks for each status.
The chart is dynamic and updates based on filters applied.
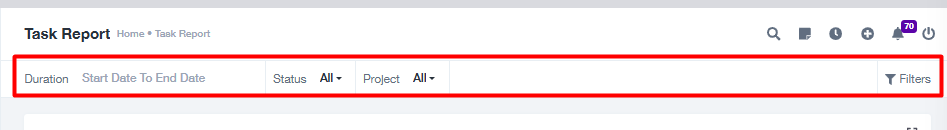
Filters and Search
Filters:
Duration: Filter tasks based on start and end dates.
Client: Narrow down tasks assigned to specific clients.
Assigned To: Filter tasks by the person responsible.
Assigned By: Filter tasks by the creator of the task.
Label: Filter tasks by custom labels.
Task Category: Choose specific task categories to view.
Billable Task: Filter tasks based on billable or non-billable criteria.
Search:
Search tasks by keywords such as task name, project, or task code.
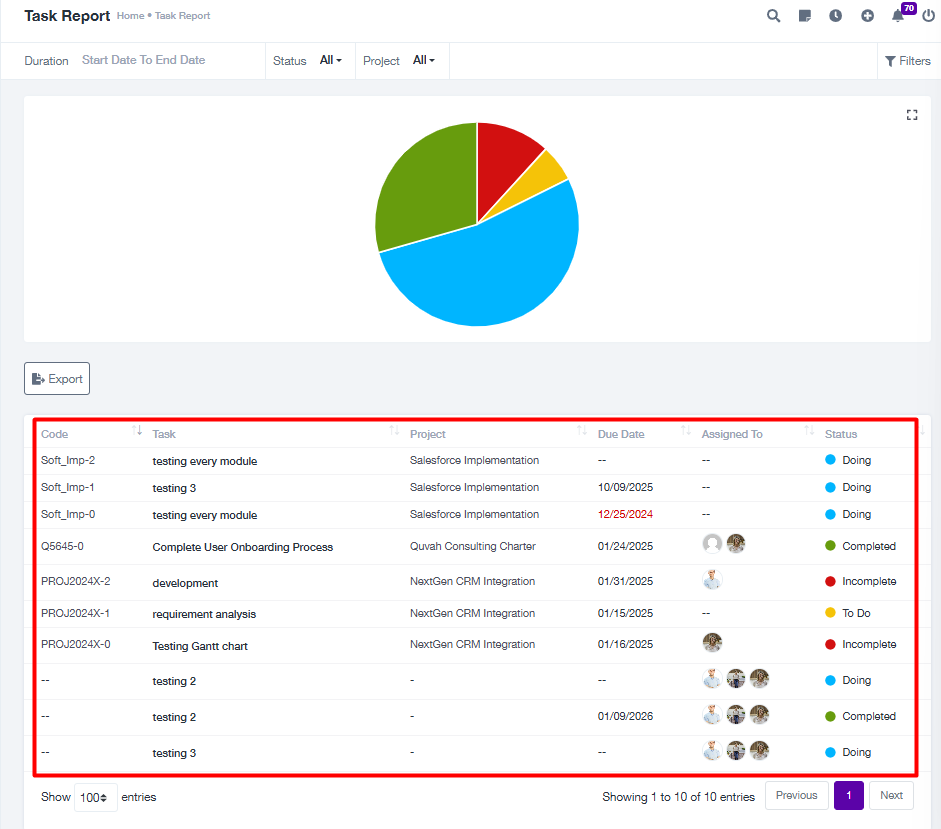
Task Code Listing
Description: A table that lists all tasks along with detailed attributes:
Code: Unique identifier for each task.
Task Name: The title of the task.
Project: The associated project name.
Due Date: Deadline for the task completion.
Assigned To: Person or team responsible for the task.
Status: Current status of the task (Incomplete, Doing, Completed, etc.).
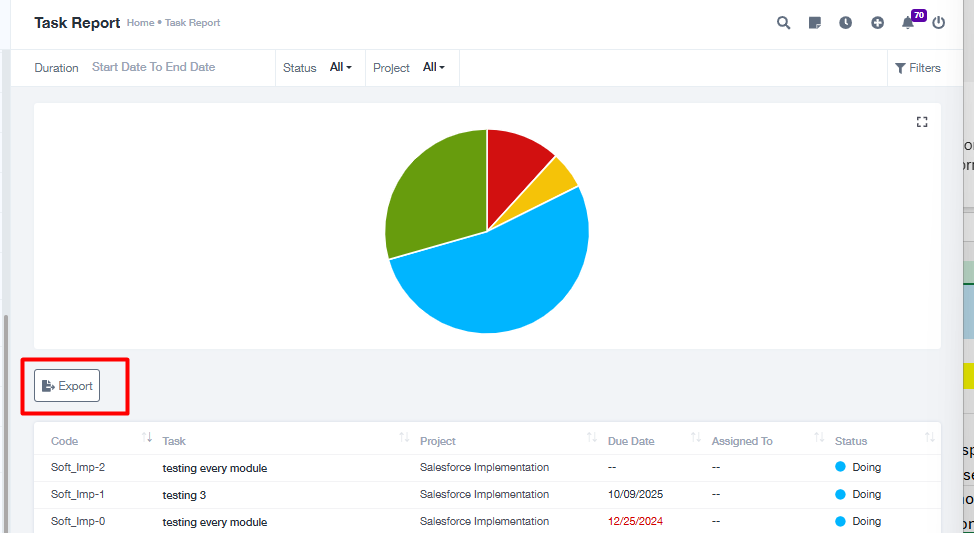
Export
Description: The entire task report can be downloaded for offline use in a preferred file format (e.g., CSV, Excel).
How to Use
Navigate to Reports > Task Report.
Use the filters on the right-hand side to refine the task list or adjust the graph dynamically.
View the updated pie chart for task statuses and the task table below it.
To export the report:
Click the Export button to download the task data in the chosen format.
Use the search bar to find specific tasks or projects quickly.
FAQs
What does the pie chart represent?
The pie chart provides a visual summary of the tasks categorized by their current statuses.
Can I filter tasks for specific projects only?
Yes, use the Project filter to view tasks related to a particular project.
How do I export task data?
Click the Export button, and the report will be downloaded in a specified file format.
Can I update a task directly from the Task Report?
No, updates must be made in the respective project or task management module.
Is the report updated in real-time?
Yes, the task statuses and data refresh automatically whenever a change is made in the associated tasks.
For further assistance, contact support at support@projeni.com