loading.. Please Wait
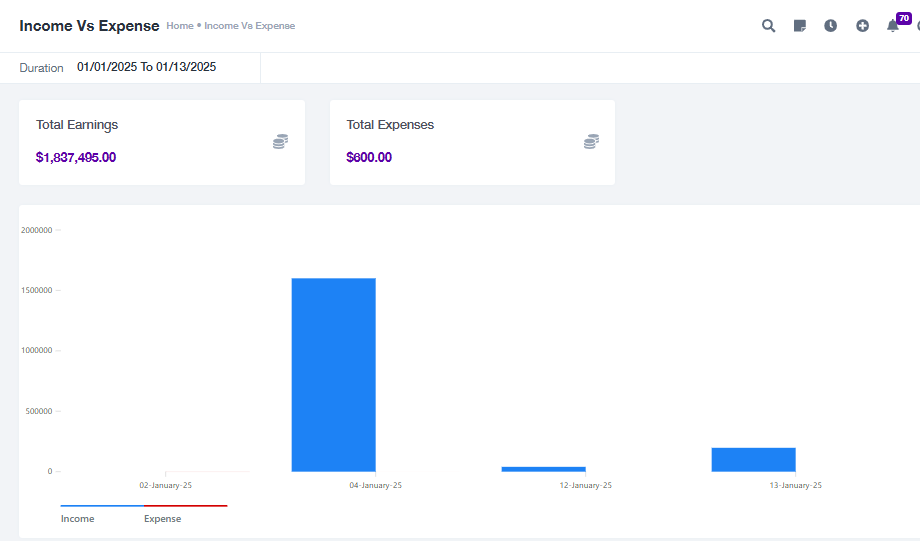
The Income vs. Expense Report submodule provides an intuitive interface to visualize and analyze the total earnings (income) and total expenses over a selected period. It includes a comparative graph, widgets displaying key metrics, and options to search and filter data.
Features:
Widgets:
Total Earnings: Displays the total income for the selected duration.
Total Expenses: Displays the total expenses for the selected duration.
Income vs. Expense Graph:
A bar graph visually compares income and expense for a specific duration.
Dynamic tooltips on hover provide detailed numerical values for income and expense.
Search and Filter:
Filters allow users to refine results based on:
Duration: Customize the report by selecting a specific start and end date.
Client: Filter income and expenses by a specific client.
Project: Refine data by project association.
Export:
Allows users to download the Income vs. Expense Report in a tabular format for offline analysis and sharing.
Interactive Visualization:
The graph updates dynamically based on selected filters, reflecting accurate data comparisons.
Actions:
Hover Over Graph: Displays specific income and expense values for a particular date.
Apply Filters: Allows users to narrow down the data shown in the widgets and graph.
FAQs:
Q1. What does the Total Earnings widget show?
A: The Total Earnings widget displays the aggregated income for the selected duration.
Q2. How do I compare data for a specific client or project?
A: Use the Client and Project filters in the top bar to refine the data displayed in the graph and widgets.
Q3. How can I download the Income vs. Expense Report?
A: Click the Export button below the graph to download the report in CSV format.
Q4. What does the graph represent?
A: The graph provides a comparative visualization of income and expenses over the selected time frame, with values displayed when hovering over a specific bar.
Q5. Why is my Total Expenses widget showing $0?
A: This indicates that no expense data is recorded for the selected duration. Verify the selected date range and filters.
Support:
If you face any issues with the Income vs. Expense Report, contact the support team with details of the issue, including the selected filters and screenshots of the report page at support@projeni.com