loading.. Please Wait
The Recruit Dashboard serves as a centralized hub to provide a quick overview of recruitment-related statistics and updates. It consists of multiple widgets that display summarized data, helping recruiters monitor progress and identify key metrics at a glance.
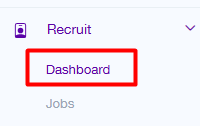
In navigation panel, click on Recruit module – Dashboard.
Widgets Overview
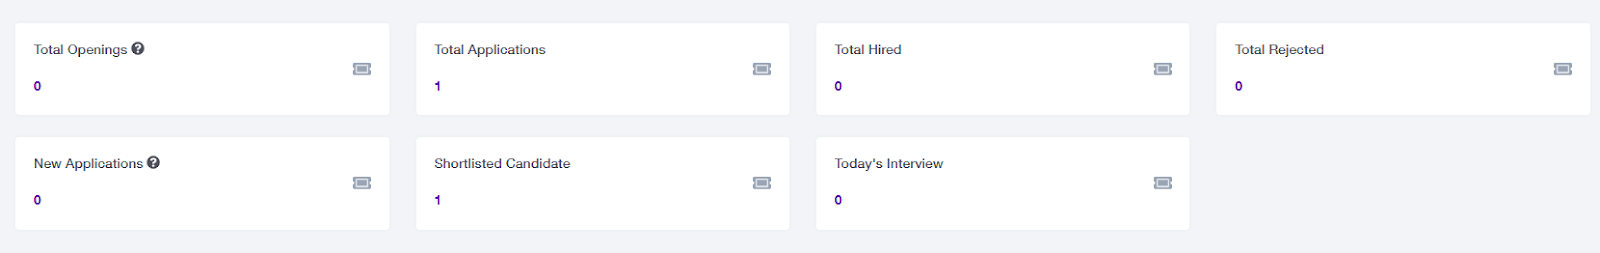
Total Openings
Displays the total number of job openings currently active in the system.
Key Metric: Count of open job positions.
Total Applications
Displays the total number of job applications received across all active job openings.
Key Metric: Aggregate count of all job applications.
Total Hired
Displays the number of candidates who have been successfully hired.
Key Metric: Total hired candidates.
Total Rejected
Displays the total number of candidates rejected during the recruitment process.
Key Metric: Rejected candidates count.
New Applications
Shows the count of new job applications received recently.
Key Metric: New applications received in a given timeframe.
Shortlisted Candidates
Displays the number of candidates shortlisted for further rounds of the recruitment process.
Key Metric: Count of shortlisted candidates.
Today’s Interview
Lists the scheduled interviews for the current date. If no interviews are scheduled, it shows a "No record found" message.
Key Metric: Scheduled interviews for the day.
2. Detailed Sections
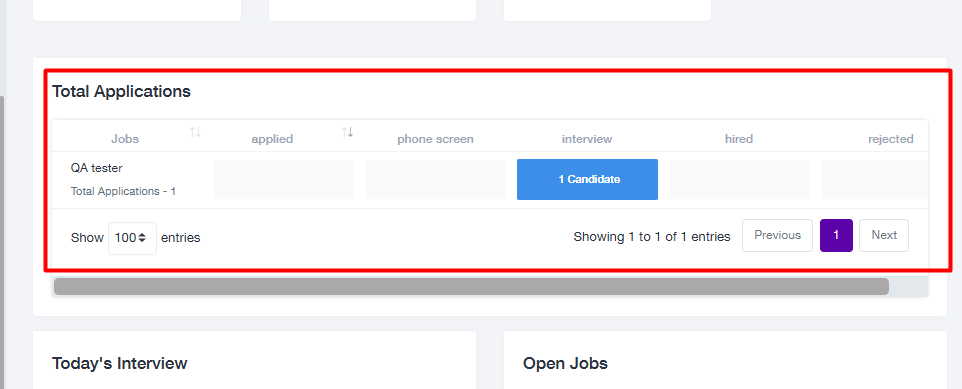
Total Applications Table
Lists job applications under specific statuses (e.g., Applied, Phone Screen, Interview, Hired, Rejected).
Provides job-specific data such as the total applications per job.
Interactive navigation to view detailed candidate records for each status.
Open Jobs List
Displays active job openings along with the recruiter assigned to the job.
A View button allows quick navigation to the job details.
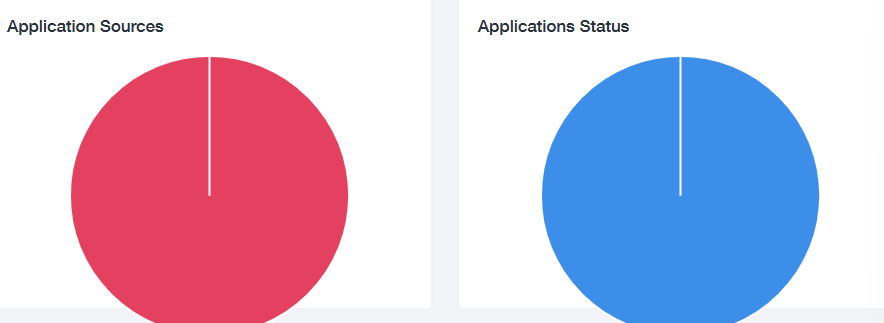
Application Sources Pie Chart
Displays a visual breakdown of where job applications originated (e.g., career site, referrals, job boards).
Helps track the effectiveness of different recruitment channels.
Applications Status Pie Chart
Shows the distribution of job applications across various statuses (e.g., Applied, Shortlisted, Hired, Rejected).
Provides insights into the recruitment funnel.
How to Use
1. Access the Dashboard
Navigate to Recruit > Dashboard in the sidebar menu.
2. Interpret Widget Data
Use widget counts to assess overall recruitment progress:
Check Total Openings to see how many positions still need to be filled.
Monitor New Applications to identify fresh leads.
Track Shortlisted Candidates for further follow-up.
3. Drill Down into Data
Click on entries in the Total Applications Table or Open Jobs List to view detailed records.
4. Analyze Metrics
Use the pie charts to evaluate the effectiveness of sourcing strategies and recruitment pipeline efficiency.
FAQs
1. Why does the “Today’s Interview” section show “No record found”?
This means there are no interviews scheduled for the current date. Verify the interview schedule for upcoming dates.
2. Can I customize the widgets on the Dashboard?
At this time, the Dashboard widgets are not customizable. Future updates may include customization options.
3. What is the data refresh frequency for Dashboard metrics?
Dashboard data is updated in real-time as changes are made in the system.
4. How can I filter data in the Dashboard widgets?
The Dashboard does not support direct filtering, but you can navigate to the respective submodules (e.g., Jobs or Job Applications) for advanced filtering options.
For further support, please contact the Support Team at support@projeni.com